//Kevin Anderson /October 9 / 2012
Mapping data from a Google form audience survey
We recently covered how to collect information from your audience using a Google form, and we’ll now cover some of the ways that you can use that information.
Of course, one of the benefits of the survey is that you can collect contact information for those who took part. Journalists on staff can look through the responses for interesting leads, and if the leads left contact details, they can follow up with those members of your audience.
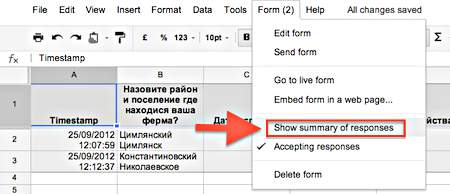
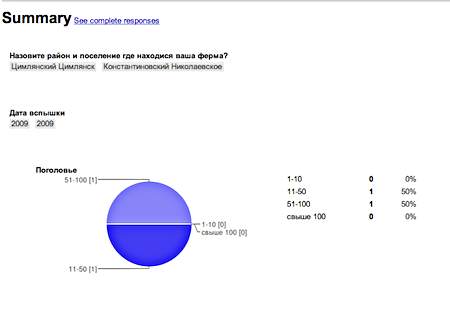
As you collect information, you can view a summary of the responses, to quickly get a sense of trends in your survey. From the spreadsheet, where your responses will be collected, you can access this summary from the Form option in the menu. The number in parentheses will show you how many responses you have.
Select “Show summary of responses” to see charts and an overview of the responses thus far.
You won’t want to run the survey indefinitely. When you have collected the responses that you want, you can uncheck the menu item “Accepting responses” from the Form menu. This will close the form to submissions.
Mapping your survey responses
There are a number of services that you can use to map information, including services such as BatchGeo and ZeeMaps. In addition to these general, global services, there are specialist services that focus on specific countries such as 2gis.ru for Russia.
For this example, we’ll look at another service from Google, Google Fusion Tables. It has recently been integrated into Google Drive, but if you have a Google Drive corporate account, you might have to ask your administrator to add Fusion Tables to your service.
Fusion Tables is a powerful application to analyse large amounts of data, but while it is very powerful, it is also relatively simple. Google has collected a number of ways that news organisations, governments and others are using the service to map, chart and visualise information. The reason why we’re focusing on Fusion Tables is because the service is particularly good at mapping data, and as long as you have the city and state or region, it is relatively reliable in accurately mapping locations.
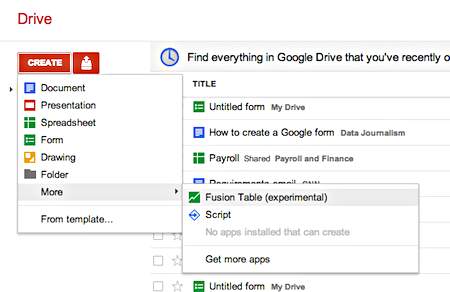
The first step is to create a new Fusion Table. To do this, go to Create and click on More, which will show you the option to create a new Fusion Table.
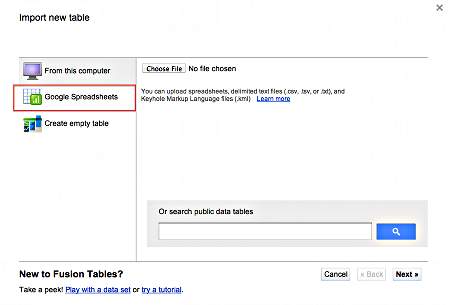
This will give you four options
1. To upload a dataset from your computer.
2. To use an existing Google spreadsheet.
3. To create an empty table.
4. To search publicly available datasets uploaded to Fusion Tables. The search form is in the lower, right hand side of the window rather than the three other options to the upper left.
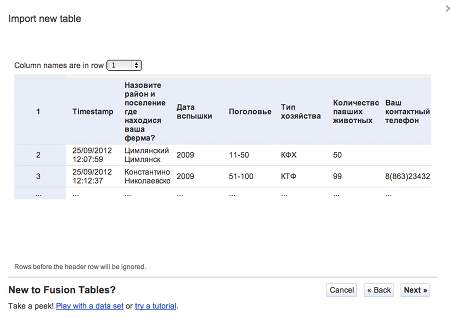
You will want to use the existing Google spreadsheet that has your survey data. When you select this option, you will see a list of spreadsheets that you have in Google Drive including the spreadsheet that has your form and responses. When you select your spreadsheet, it will give you a preview of how your data will look when it is imported into Fusion Tables so you can make sure that the import has worked correctly. You can also choose the row which has the labels for your data. This will almost always be the first row when you import a spreadsheet based on a form.
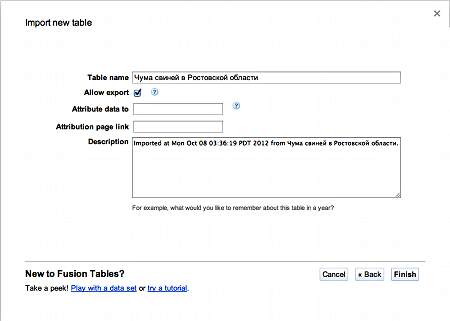
If the spreadsheet looks correct, simply click the next button. The next screen will ask you some information about the data that you are uploading, including the source of the data. News organisations frequently have uploaded public information to Google Fusion Tables, and this allows journalists to post some information on the source of the data. In this case, you have collected your own data, and you should enter the address of your own news website.
Now your survey data will be in Google Fusion Tables. It will look similar to your spreadsheet but without the gridlines.
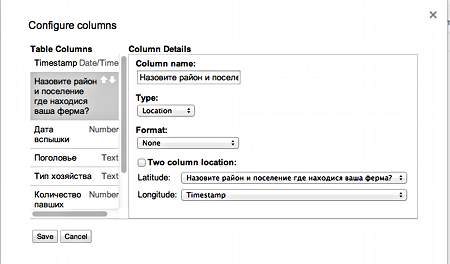
Fusion Tables is simple to use because it is focused on only a few types of data: Text, number, data/time or location. In some instances, if you have a column of place names, it will automatically detect that this is location information, but if Fusion Tables doesn’t automatically identify the location, you can tell the service which column or columns contain location information. To change the data type for your columns, go to Edit menu and selection Modify columns. This will bring up a window that tells you the data type of your columns. You can choose the data type, and if you have longitude and latitude data rather than city and state or region, you can use a two-column location format and set which columns contain the relevant information.
From this window, you can also delete the columns containing the time stamp and the contact information. You won’t need these for your map, and in the case of the contact details, you don’t want to make this public. To delete a column, simply select the name of the column. It will show you up and down arrows and an X. Click on the X to delete the column, and then hit the save button at the bottom of the Configure columns window.
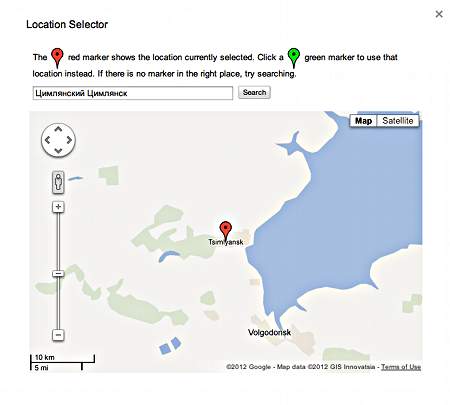
After you change the data type of your column with information, you’ll notice the change because the information in that column will not be highlighted in yellow. If you hover your mouse pointer over your locations, two icons will appear. The first, a stylised blue sphere, is the Google Earth logo and the second allows you to leave a comment in your table. If you click on the blue sphere, it will bring up a map and show you where it believes the location is. If this is incorrect, you can change it by typing in new location information using a search form. You can correct the location by clicking on the green map pin of the right location from your search.
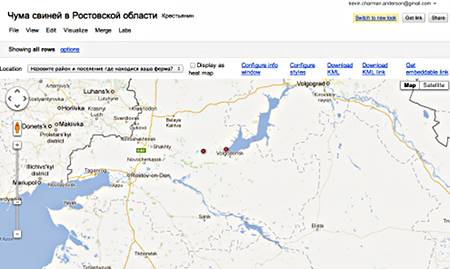
To map your survey responses, simply go to the Visualise menu option and select Map. The first time you create your map, you will see a progress bar as the service geo-codes, or maps, your locations. After it is finished, you should see pins that relate to your survey responses. Sometimes, you will need to click once on the map to force it to refresh and show your locations.
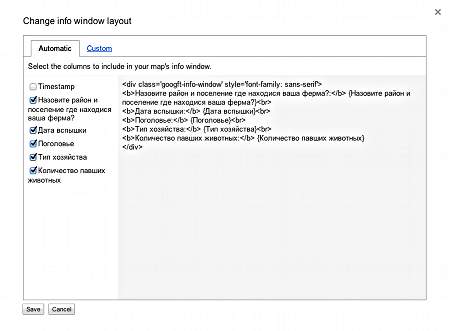
Above the map, you will see a number of options, including Configure info window, Configure styles, Download KML, Download KML link and Get embeddable link. The first one allows you to choose what information is included in the pop-up window when a user clicks on a map pin. For instance, you might not want to include the Timestamp information. To prevent this from being displayed, simply click on the Configure info window link and uncheck the box before Timestamp.
Also notice at the top of the window that there are two tabs, the second one being Custom. This allows you to make some basic modifications to the style of the text.
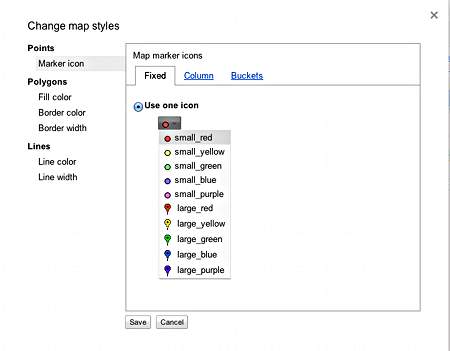
The Configure styles window allows you to change the style of the pin that you use including using custom icons. This window also allows you to use different colour icons based on the data in your survey. For instance, if you asked people to respond to a scale question, possibly asking them on a scale of 1 to 5 how they approved about government response to an issue, you could colour the pins differently based on the response to that question. That is possible with the option called “Buckets”, which we will cover in greater depth in another post.
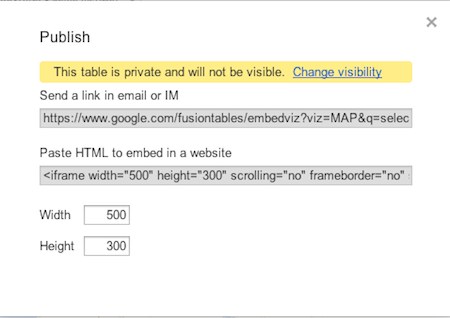
The last three links allow you to take your map data to other mapping services or simply to embed the map on your site. Download the KML or the KML link allow you to use other map services that use Google’s open-source mapping data format, KML. To embed the map in your own website, click on Get embeddable link. This will open a window with a simple link and also the HTML embed to embed it in your site. You can also customise the height and width so that it fits into your story column width.
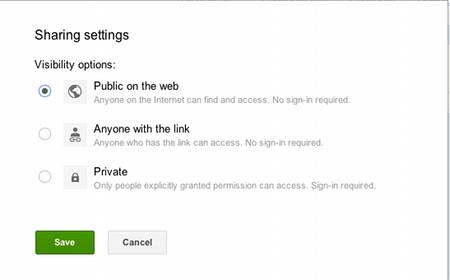
Note the message highlighted in yellow that says that the table is private and will not be visible. Just like all documents in Google Drive, every document in Fusion Tables has sharing and privacy options. By default, you only have access to the table, but to make the map visible, you will have to make the table public. Click on the link to change visibility. After clicking on this link, the options for privacy and sharing will open. You want to change the table from being private to being public in order to embed it in your website.
Now you can use the embed code, and your map will appear in your website. You can do a lot more with Fusion Tables including quickly analysing a large amount of data and also creating maps with special boundaries such as political districts or even to show how different areas might be affected by a flood or major storm. You can even highlight road conditions as was done after the earthquake and tsunami in Japan in 2011. It’s a powerful but simple tool. If you have any questions, let us know in the comments, and we’ll do our best to answer them.
Article by Kevin Anderson


Leave your comment